Heiken-Ashi Algo // CSC Fib Strat

Hey Coffeeheadz,
I will explain more at the end, but I would love some feedback and solutions to issues I've come across, primarily based around my inability to set useful alerts for this strategy. You'll find I use some ICT/DTFX terminology to help me select which trades to take and which to stay out of. I'll define these when necessary, but DTFX concepts in particular constitute much of the discretionary part of my strategy. There's countless ways to interpret markets, and for whatever reason, DTFX's concepts resonate with my style well. When used with CSC's indicators & concepts, I have found a clarity I had previously been unable to achieve. YMMV. I'm going to use a SOL long to illustrate this strategy.
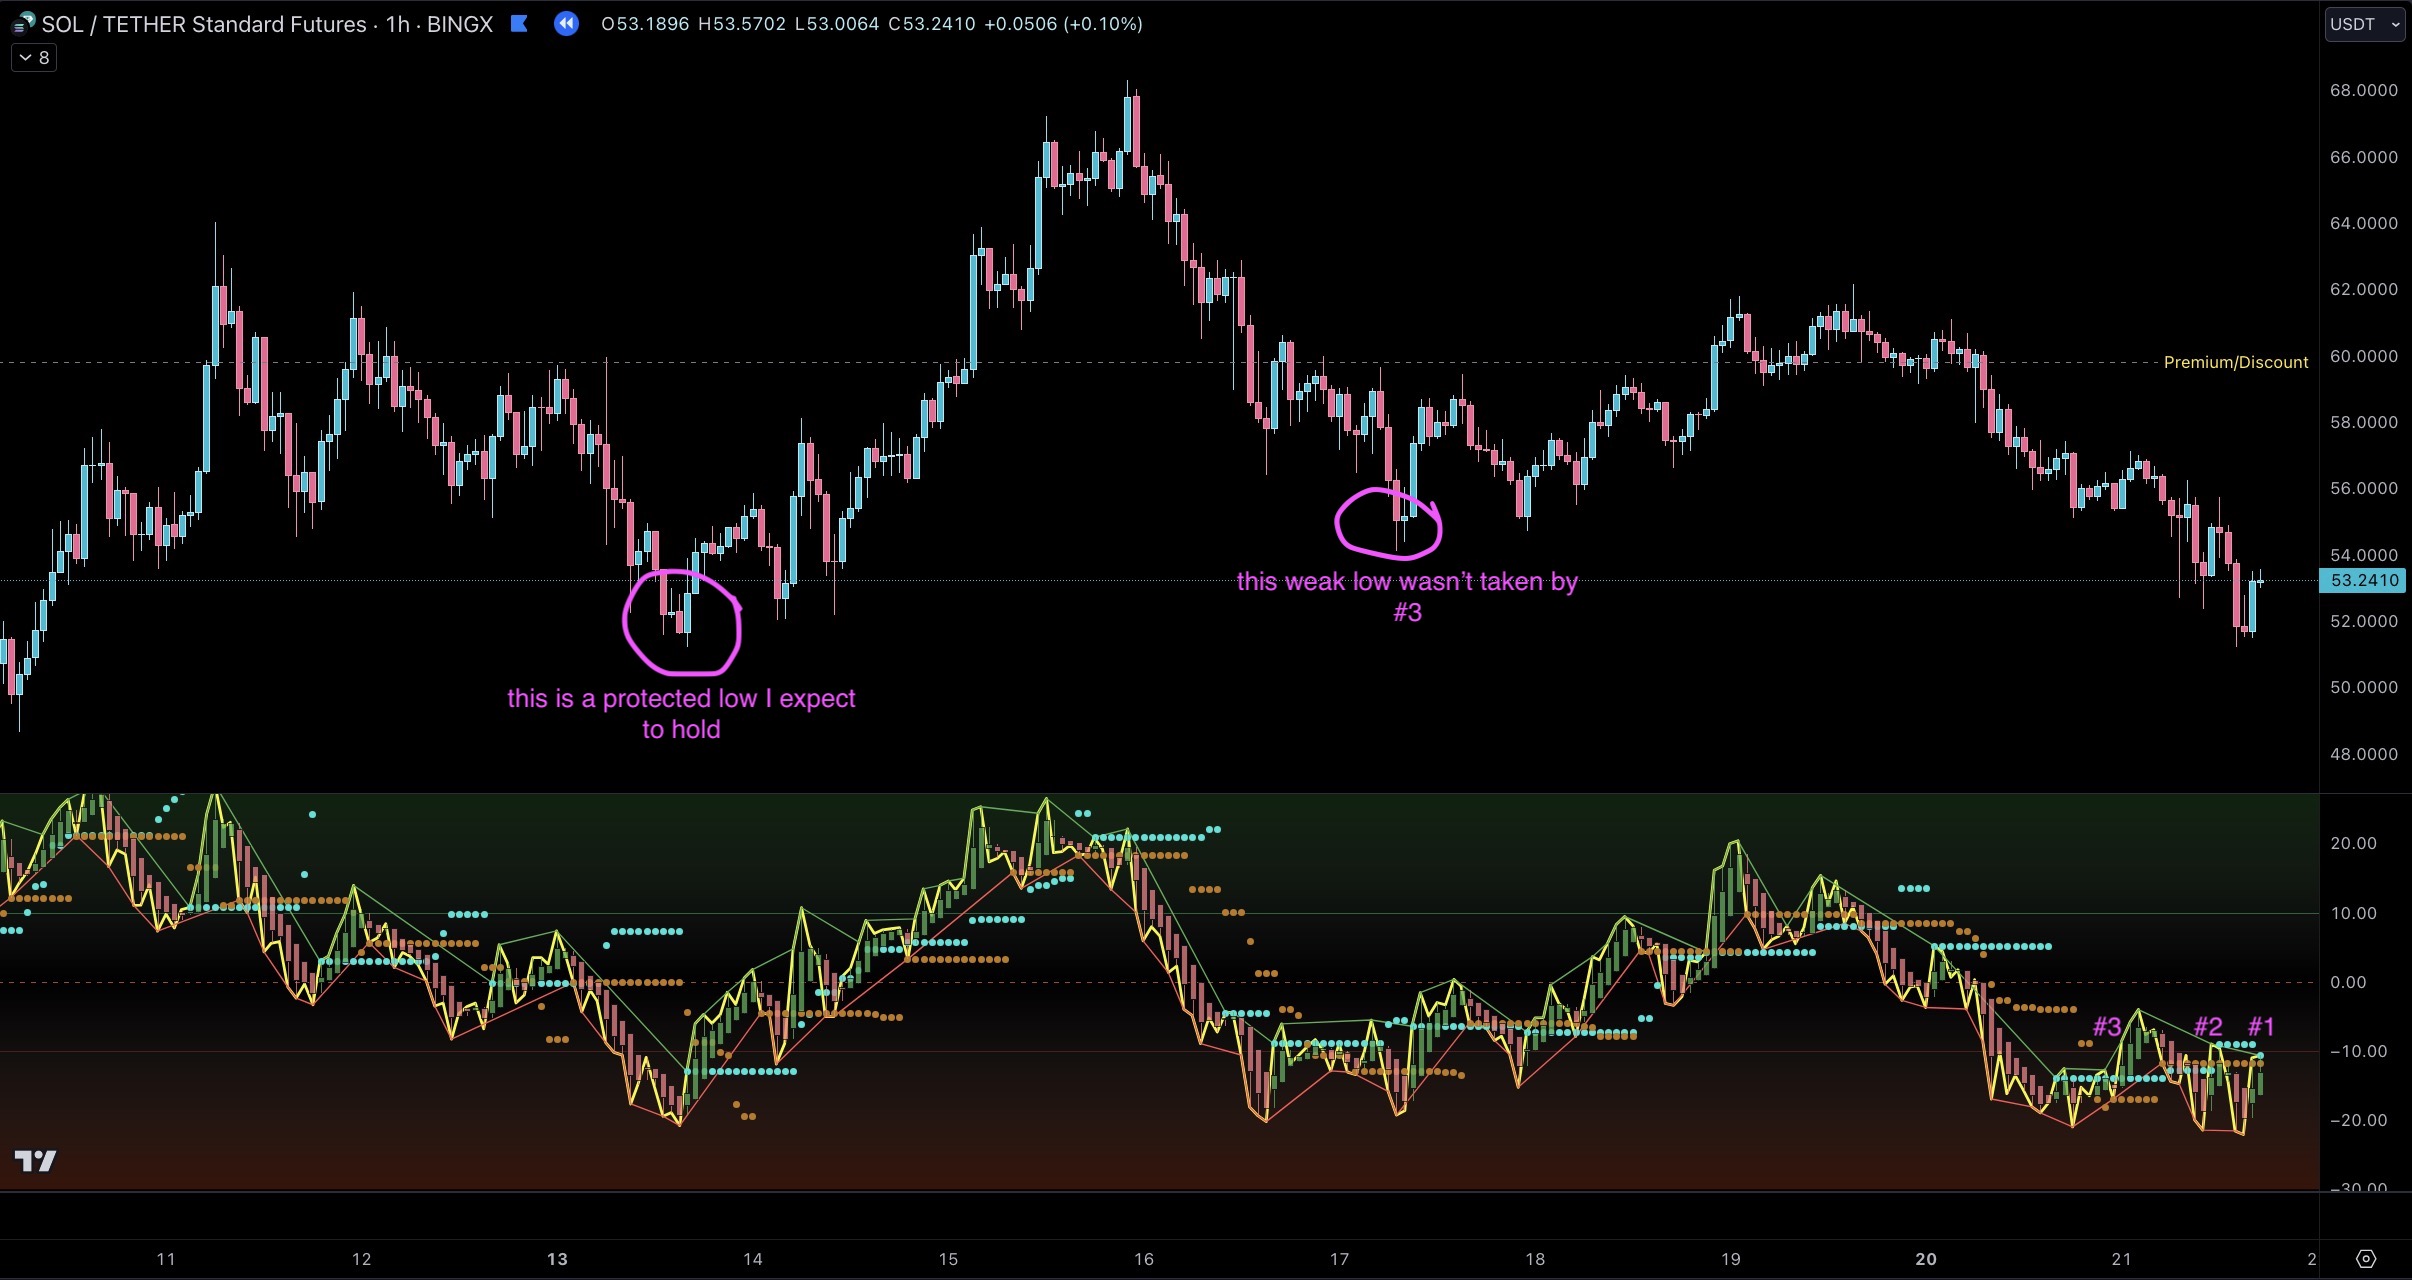
1. I look at market structure on the daily, 4-hour, and 1-hour time frame. Are we trending up, trending down, or are we in a range? What is the narrative? Where is liquidity likely to be resting and where are the high time frame (HTF) highs and lows that price is likely to be drawn to? Whatever the HAA tells me, I first make sure I'm going with the HTF trend, and I only take longs when in discount and shorts when in premium (If you need an intro to discount/premium, this vid does the trick.). A HTF assessment of price helps me from recklessly longing into supply or shorting into demand. Since I'm interested in intraday trading, I use the 1-hour and 15-minute time frames to take note of zones and areas of interest, but I also mark out things like daily and 4-hour imbalances, highs, lows, etc., as price can react strongly from them.
2. On the 1-hour, I look for two successive green candles on the HAA that have strength, i.e., the second candle pushes the rsi higher than the first. In the example above, we have that in successive green candle pairings #1 and #3. #2 has successive green candles, but the second candle's rsi is lower than the first. As a result, #2 is not an option for me and easy to rule out. Why didn't I take an entry on #3 despite the strength shown in the HAA candles? First, price isn't reacting strongly despite the strength of the candles in the HAA. Second, looking left, a weak low (a low in an uptrend that fails to create a higher high) was put in, and there's a good chance price will run through it considering our current hourly downtrend. #3 is under the Premium/Discount line (I want to be under this for longs), but no major HTF low has been taken out, and the weak low is still in tact. While #3 works as a short scalp, it's unlikely it's the stronger move I'm looking for. #1 is bouncing off of a protected low (a low that put in a higher high on an overall uptrend) that is the origin of the move that took us to a higher high and is in deep discount territory. Additionally, while the protected low wasn't ran, every other low was, which means anyone who had a stop loss behind any other low created over the last 8 days was stopped out & gave their liquidity back to the market. Lastly, I see a strong reaction in price in that first green candle of the #1 pairing that initially caught my interest.
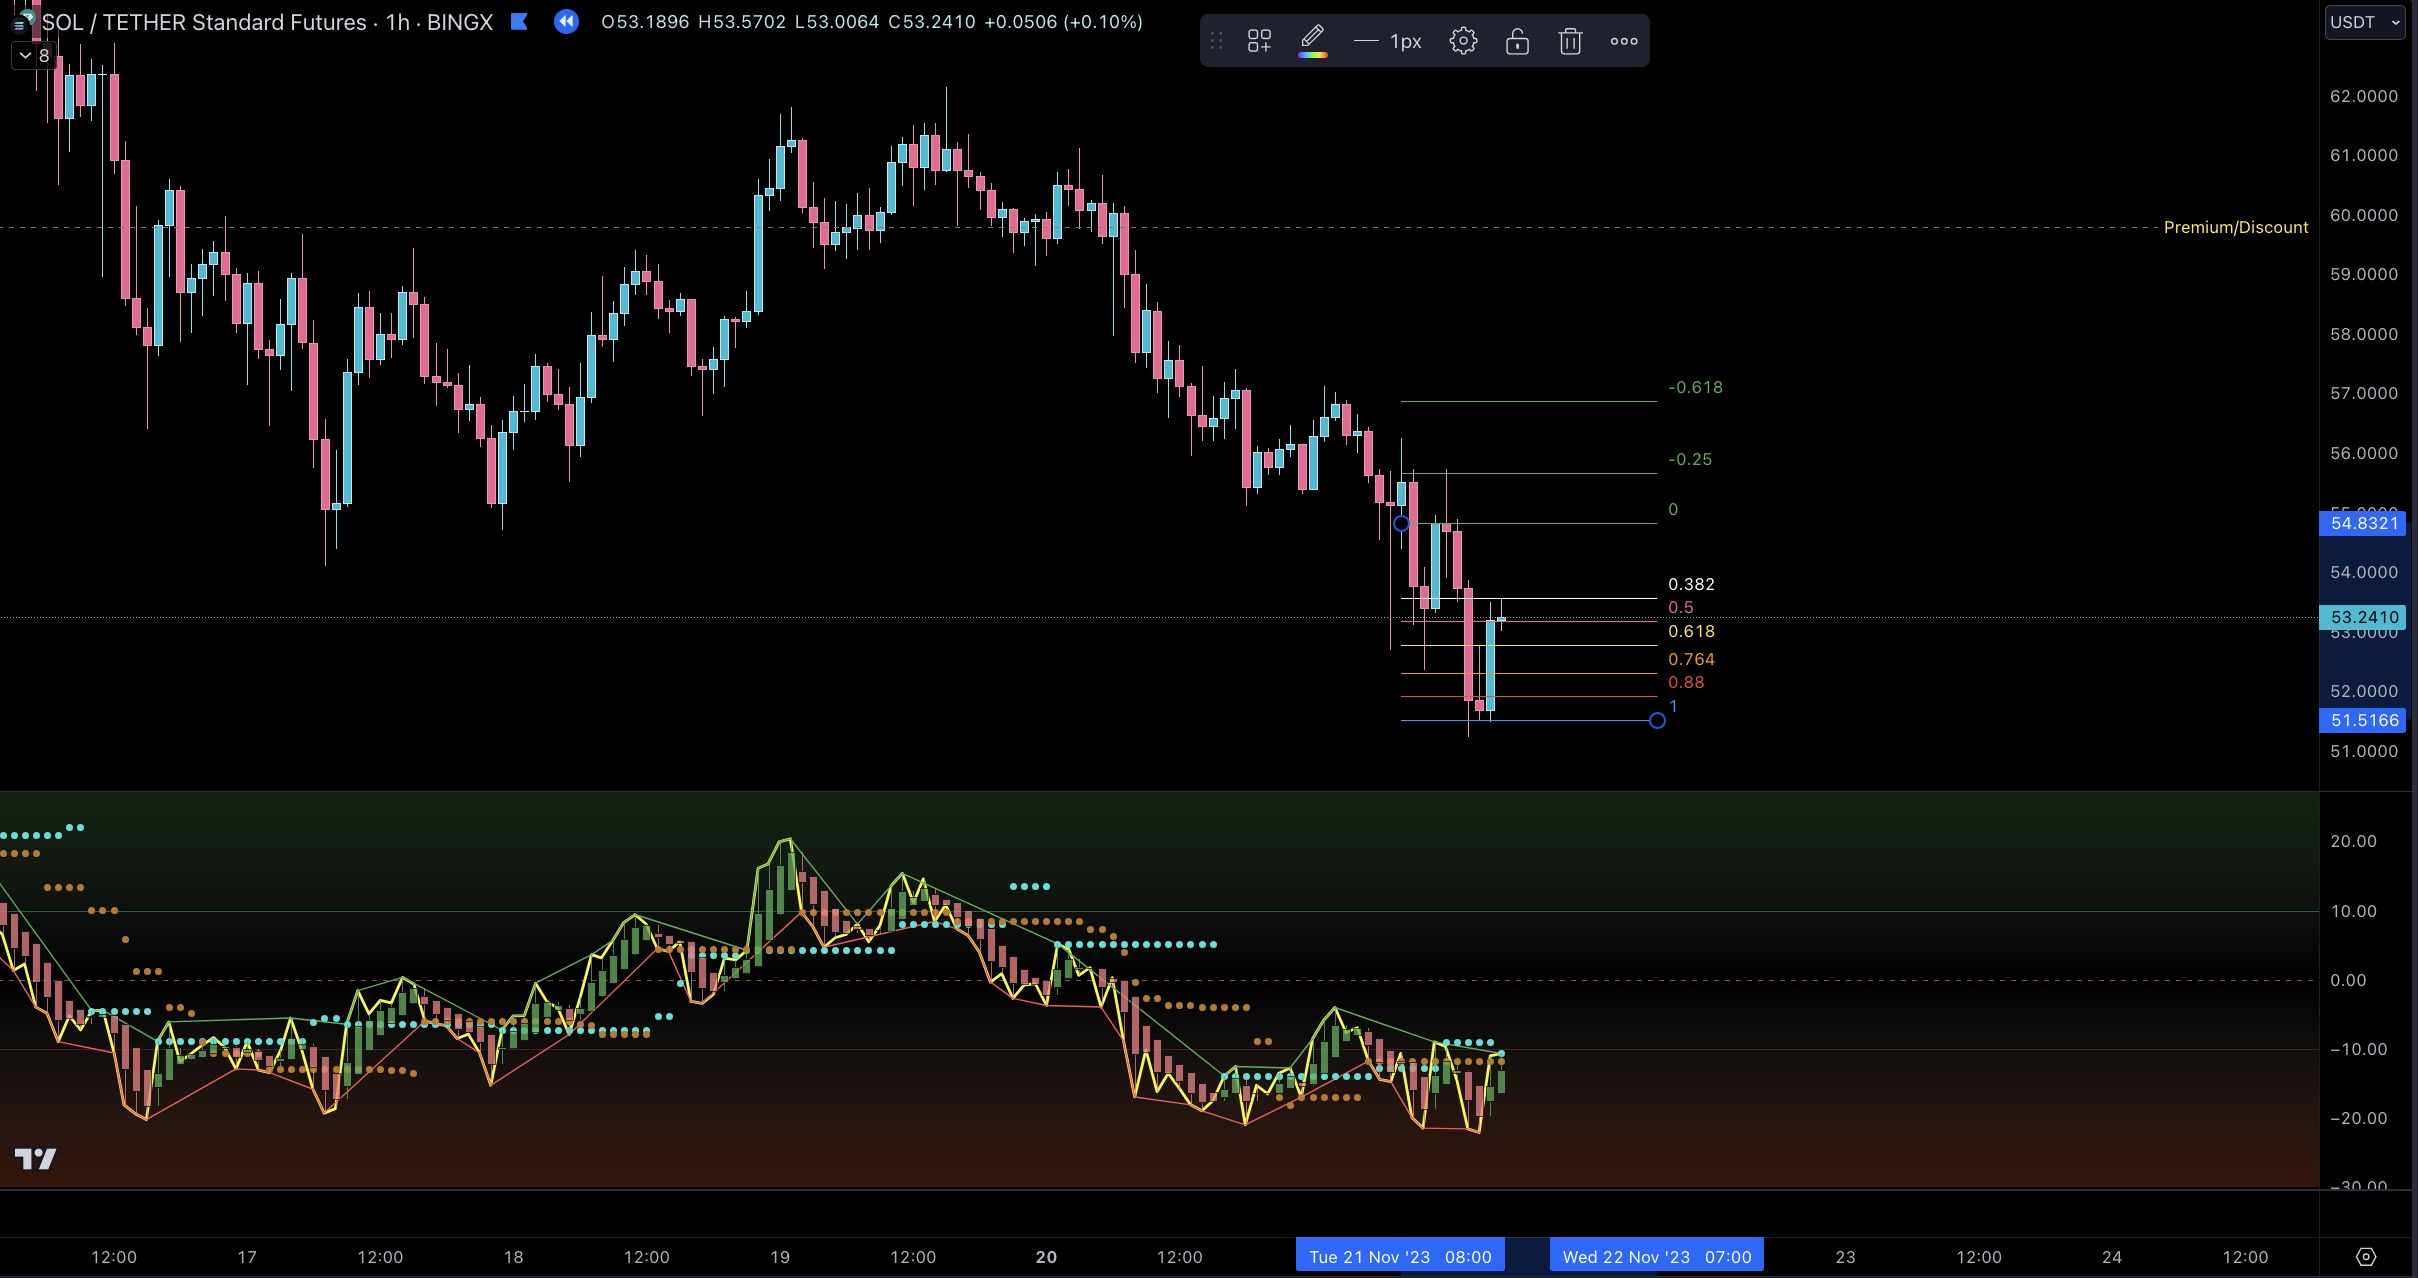
3. Because #1 fulfills the conditions above and had a nice strong bounce in price from this area of interest, I'm looking to take a trade here. I draw my fib on the price chart starting with the low of the light green candle that corresponds to the first green HAA candle. I then place the white 0.382 line at the high of the light green candle that corresponds to the second green HAA candle. I pull it back a bit just to be safe (This is advice given by CSC in one of his videos.). I need to backtest more, but currently I include the wicks when trading more volatile instruments like SOL, though I don't usually use egregiously long wicks, as some consider these manipulation, and I prefer to play it a bit more conservatively. You can see above that I could've used the long pink wick coming out of the second-to-last pink candle but chose not to.
In this case, the take-profits of the fib I drew (the 3 green lines) line up with previous short term highs, which makes these take-profits safer in my estimation. I generally don't want my take-profits pushing past previous highs, as 1. I prefer minimal drawdown with less time spent in the trade, and 2. it's safer to assume price will touch these highs rather than blast though them. I layer low leverage bids at 0.618 and 0.764, though it's quite possible price never reaches back to these levels. My stop losses for these are below the lowest wick in the area - in this case, the pink wick mentioned earlier that extends beyond my fib. I place horizontal lines at each 1 hour take-profit & bid level and delete the 1-hour fib.
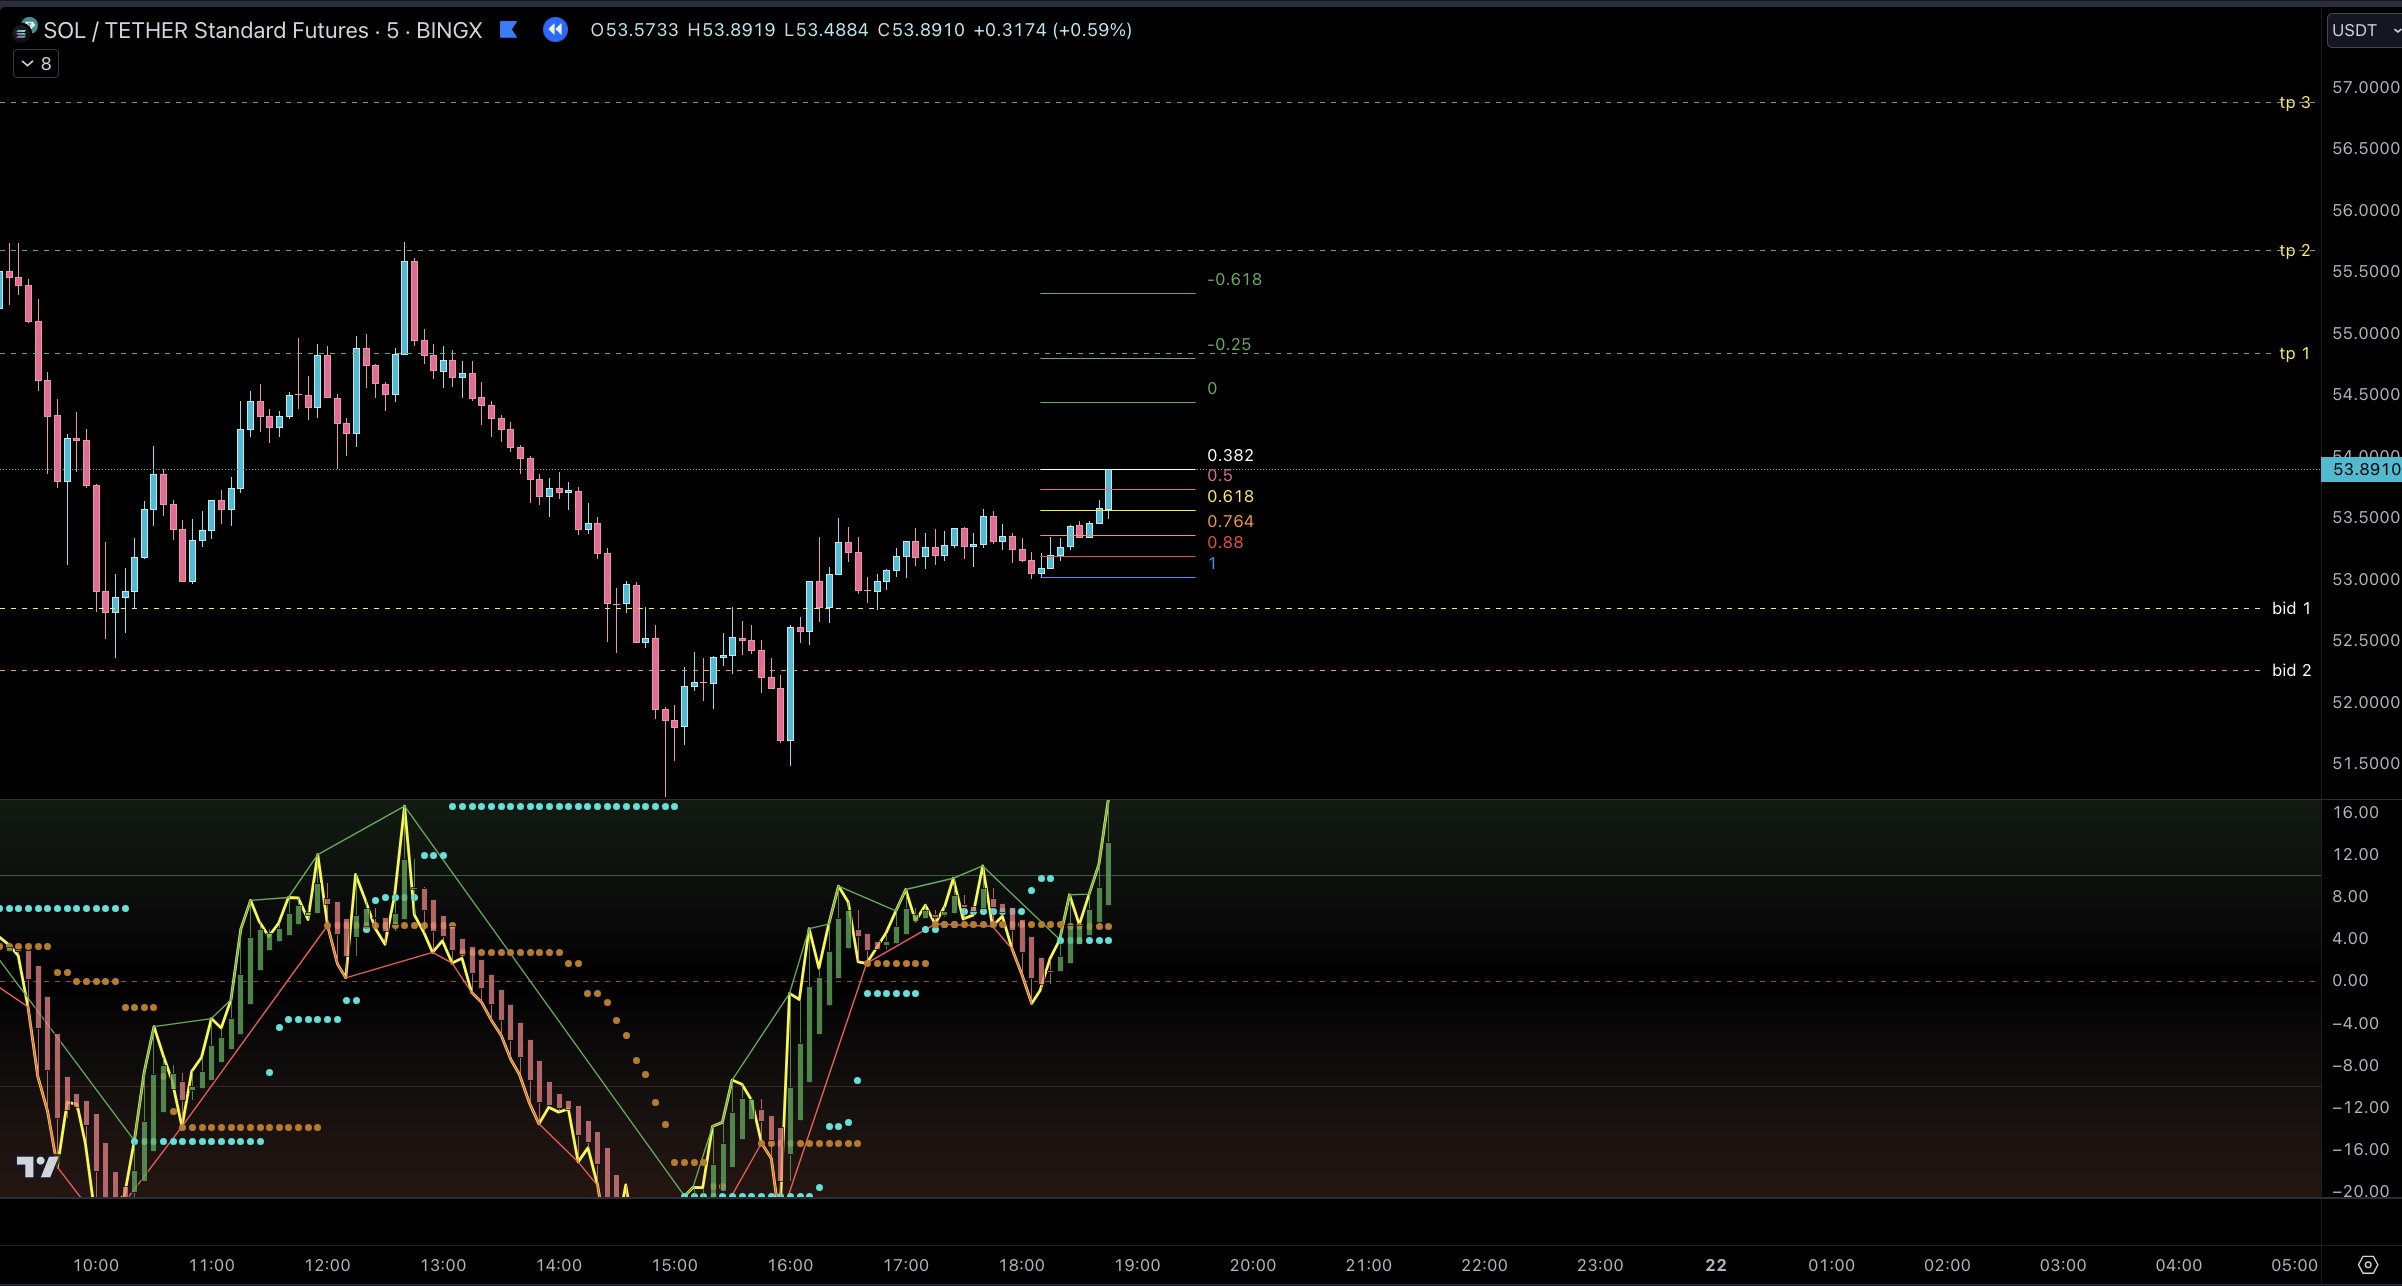
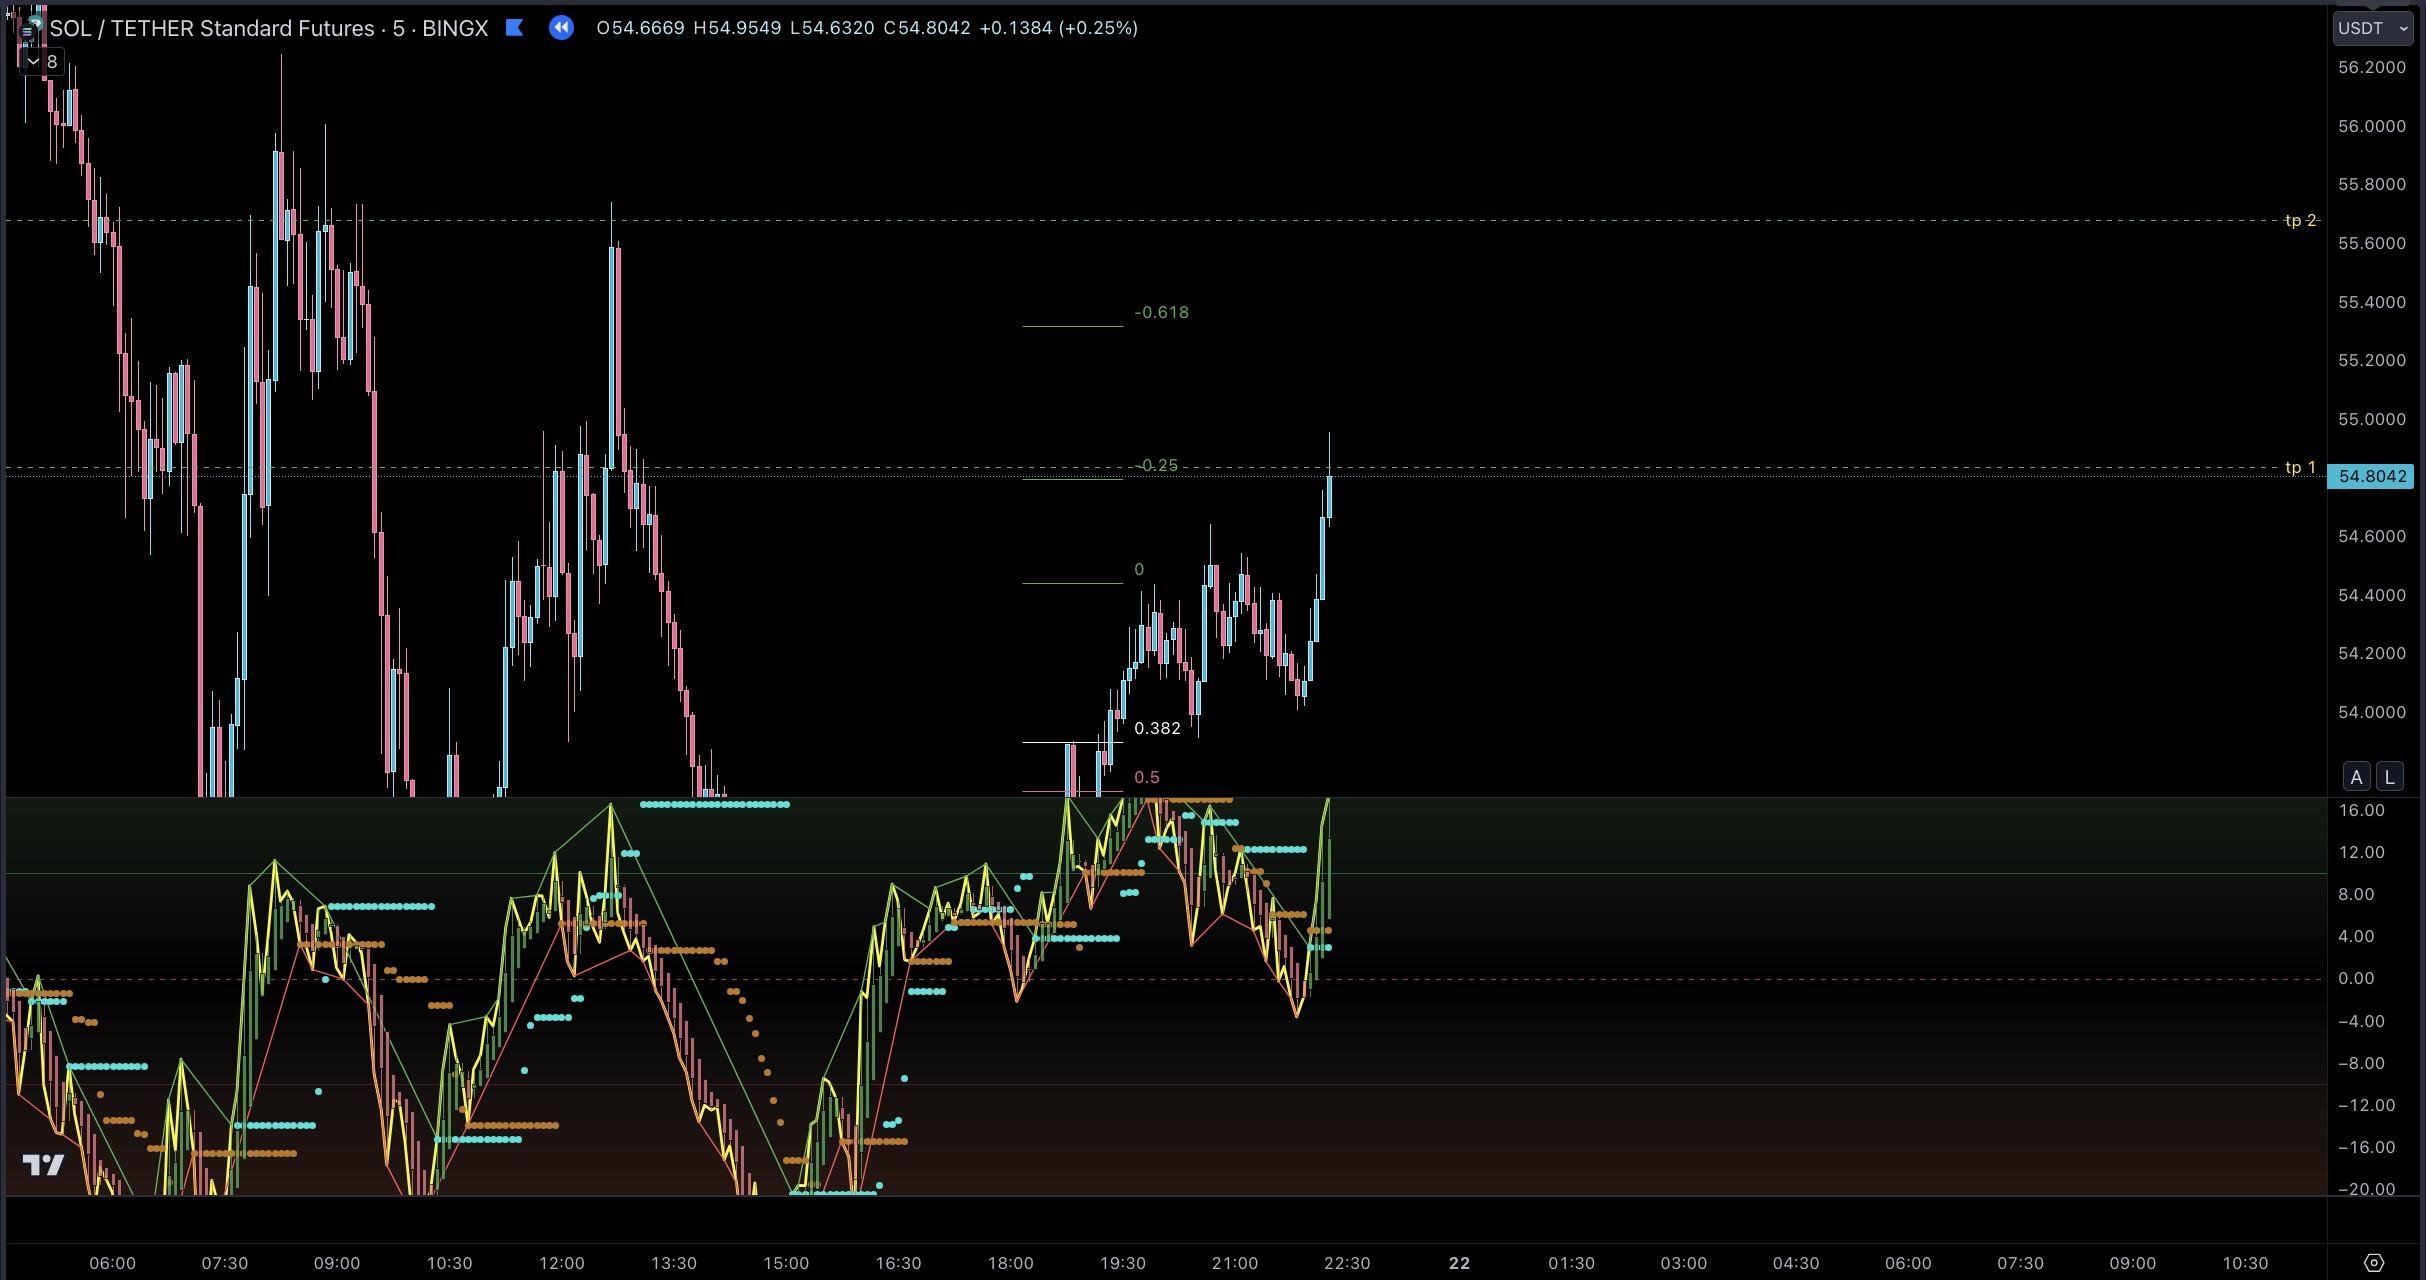
4. I go down to the 5-minute to see if there's an area to get involved in case price doesn't come back to my hourly bids. Price seems to have flipped from bearish to bullish on this time frame, as old short term highs have been taken out. Price can always do what it wants, but SOL's overall bullish trajectory + being in deep discount + strong momentum + those old short term highs being ran gives me confidence to set up a trade once a green HAA candle breaches the +10 line by over 50%. If you look at the green candles before this particular breach, none of them crossed the +10 line by over 50% and were subsequently rejected. I set a limit order at the yellow 0.618 fib line with my stop loss behind the wick that corresponds with the last down red candle on the HAA. I don't mind being stopped out if my 5 min trade idea happens to be wrong, as the HTF trend is still bullish, and I have those two 1 hour bids below. In my mind, I have two trade setups: my current trade on the 5-minute and two potential entries I set up on the 1-hour. If my 1-hour entries don't hit, but my 5-minute entry does, I can still use the 1-hour take-profits as targets should price get up there.
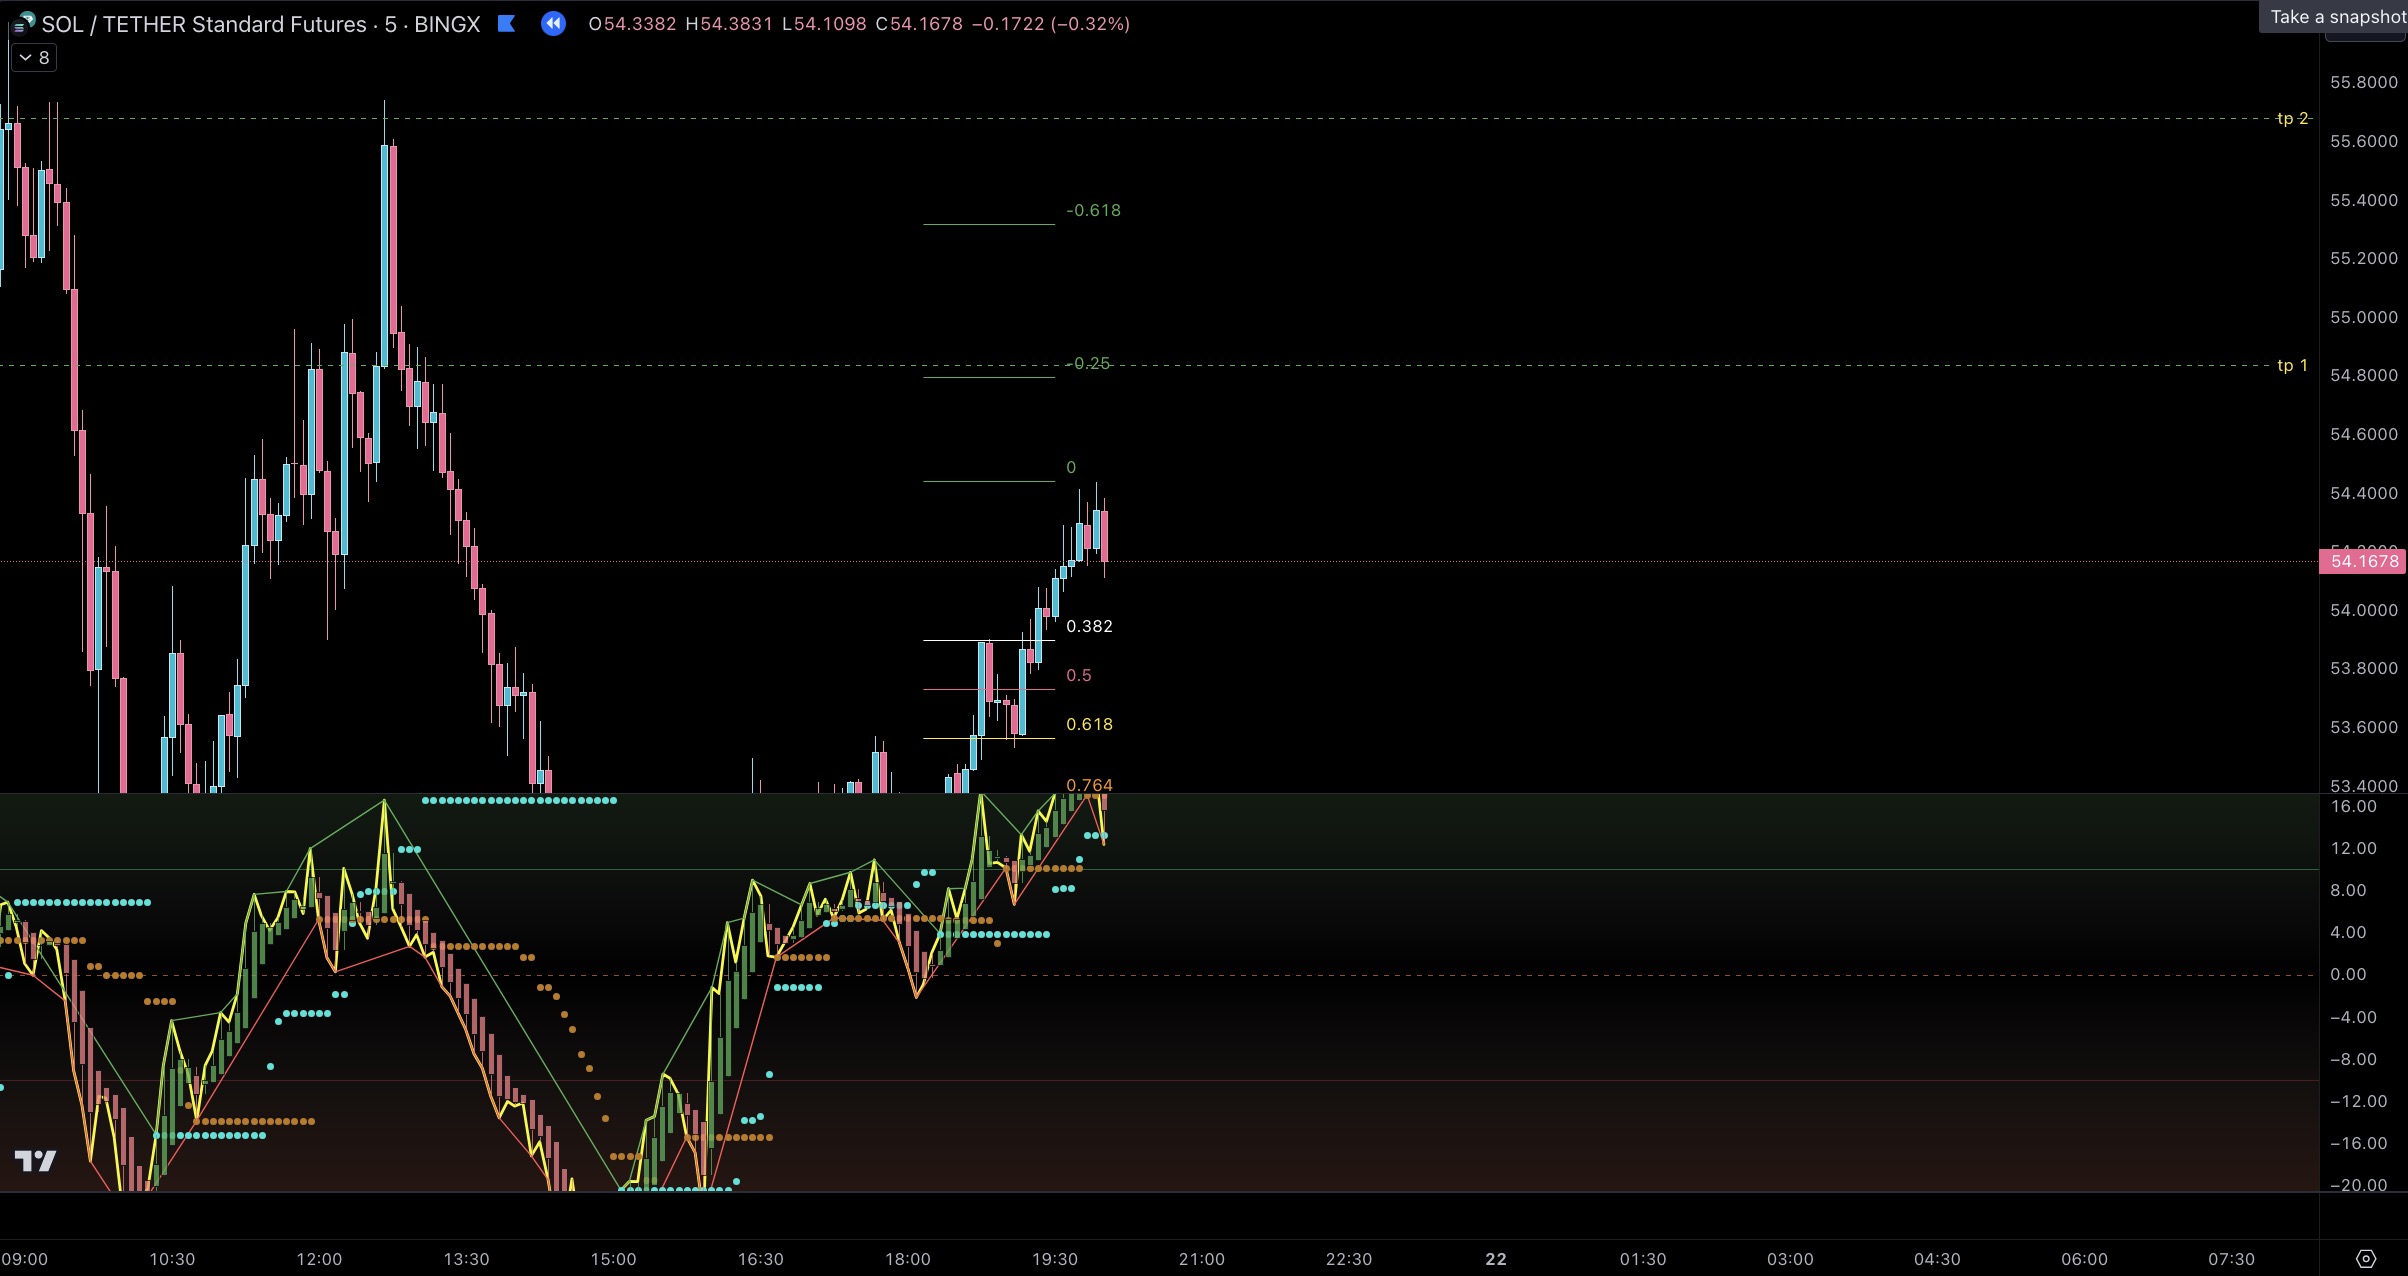
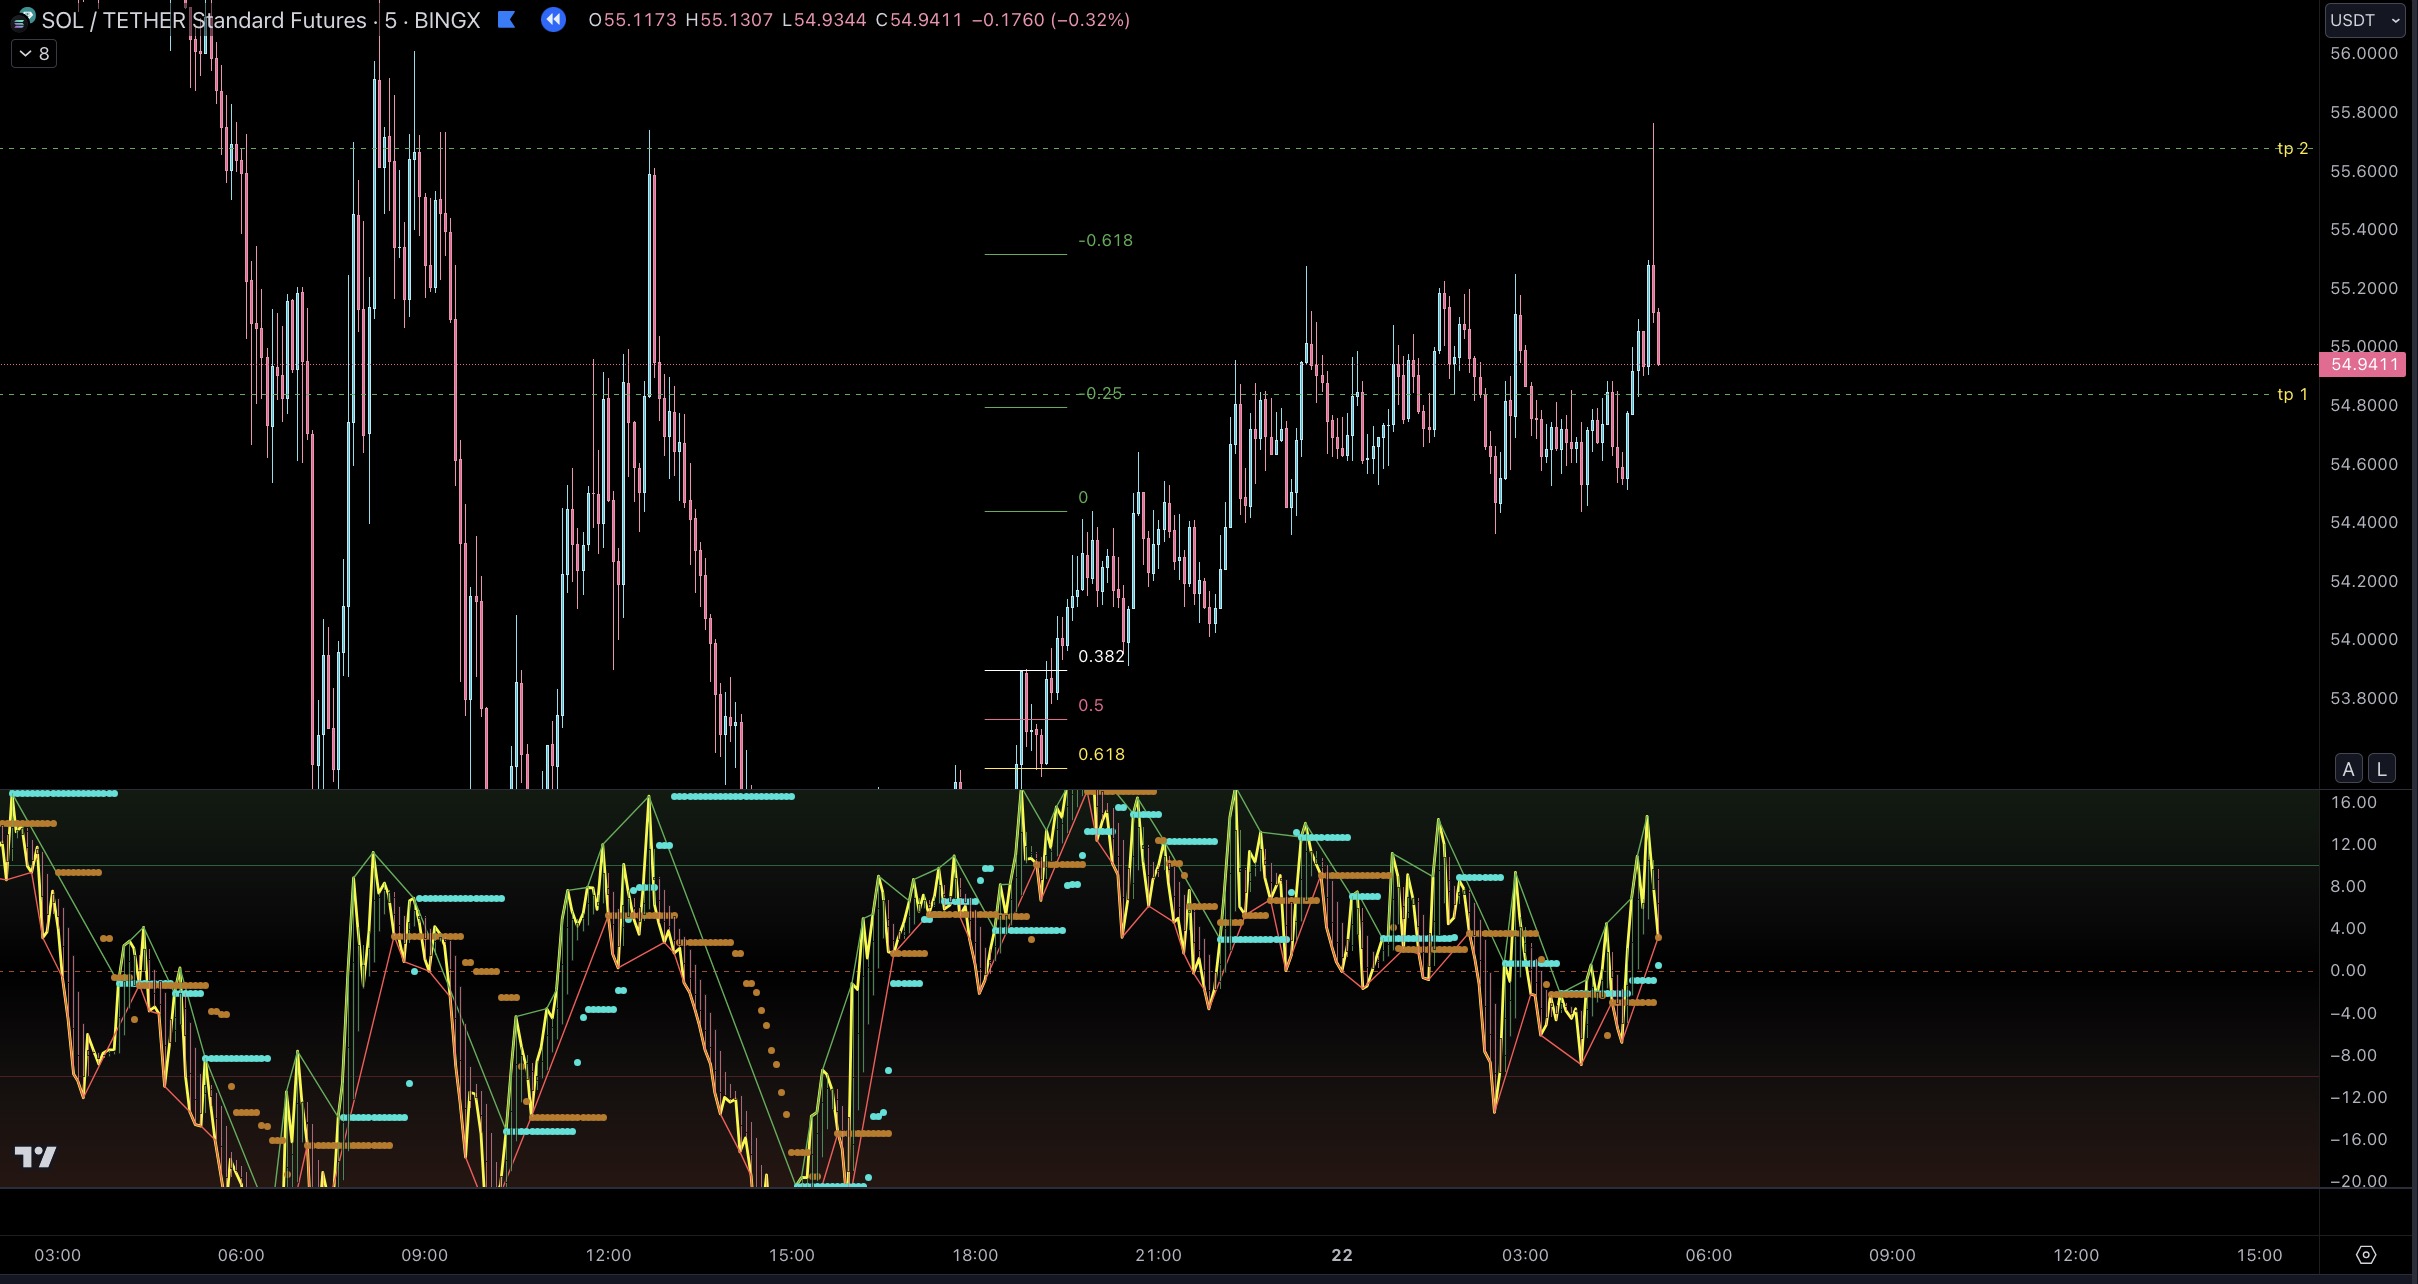
5. The 0.618 entry is hit on a pullback, so I'm in the trade, and price quickly approaches the 5-minute take profit. Through backtesting, I've found that this 0.618 level usually gets tapped into before price continues on its trajectory. There's certainly pullbacks that reach the 0.764 or 0.88 levels, but these are not as frequent as the 0.618 level on the 5-minute. I've found deeper retracements when fibbing on higher time frames, so that's something to keep in mind/backtest. I usually take 20% off here at take-profit #1, but, in this case, there's nothing much standing in the way of my 5-min take profit #2 or my 1-hour take profit #1 in terms of areas of support, unmitigated imbalances, etc. The trend is on my side, so I wait for the 5-min take profit #2. I set market order take-profits that will reduce my position size by 50% at each 1-hour and 5-minute fib level with the exception of the levels that more or less overlap, which in this case are the 1-hour tp #1 and the 5-minute tp #2. For these, I choose to use the closer take-profit, which is the 5-minute tp #2.
6. While both the 1-hour tp #1 and the 5-minute tp #2 were hit, my take profit area was the 5-minute tp #2 as mentioned previously. I believe the smaller time frame gives me more accuracy, so I tend to defer to that fib when in a trade. As mentioned previously, I have a market order here to remove 50% of my position, and I move my stop loss behind the wick at the fib's 0.382 level, which is a protected low on the 5-minute time frame. That way if I'm hit with a nasty wick or a lower time frame structure reversal, I'm stopped out but still in profit. If price has been moving too fast to put in a protected low in this area, I will still move my stop up to just above break even - behind a protected low or imbalance if one is in the area.
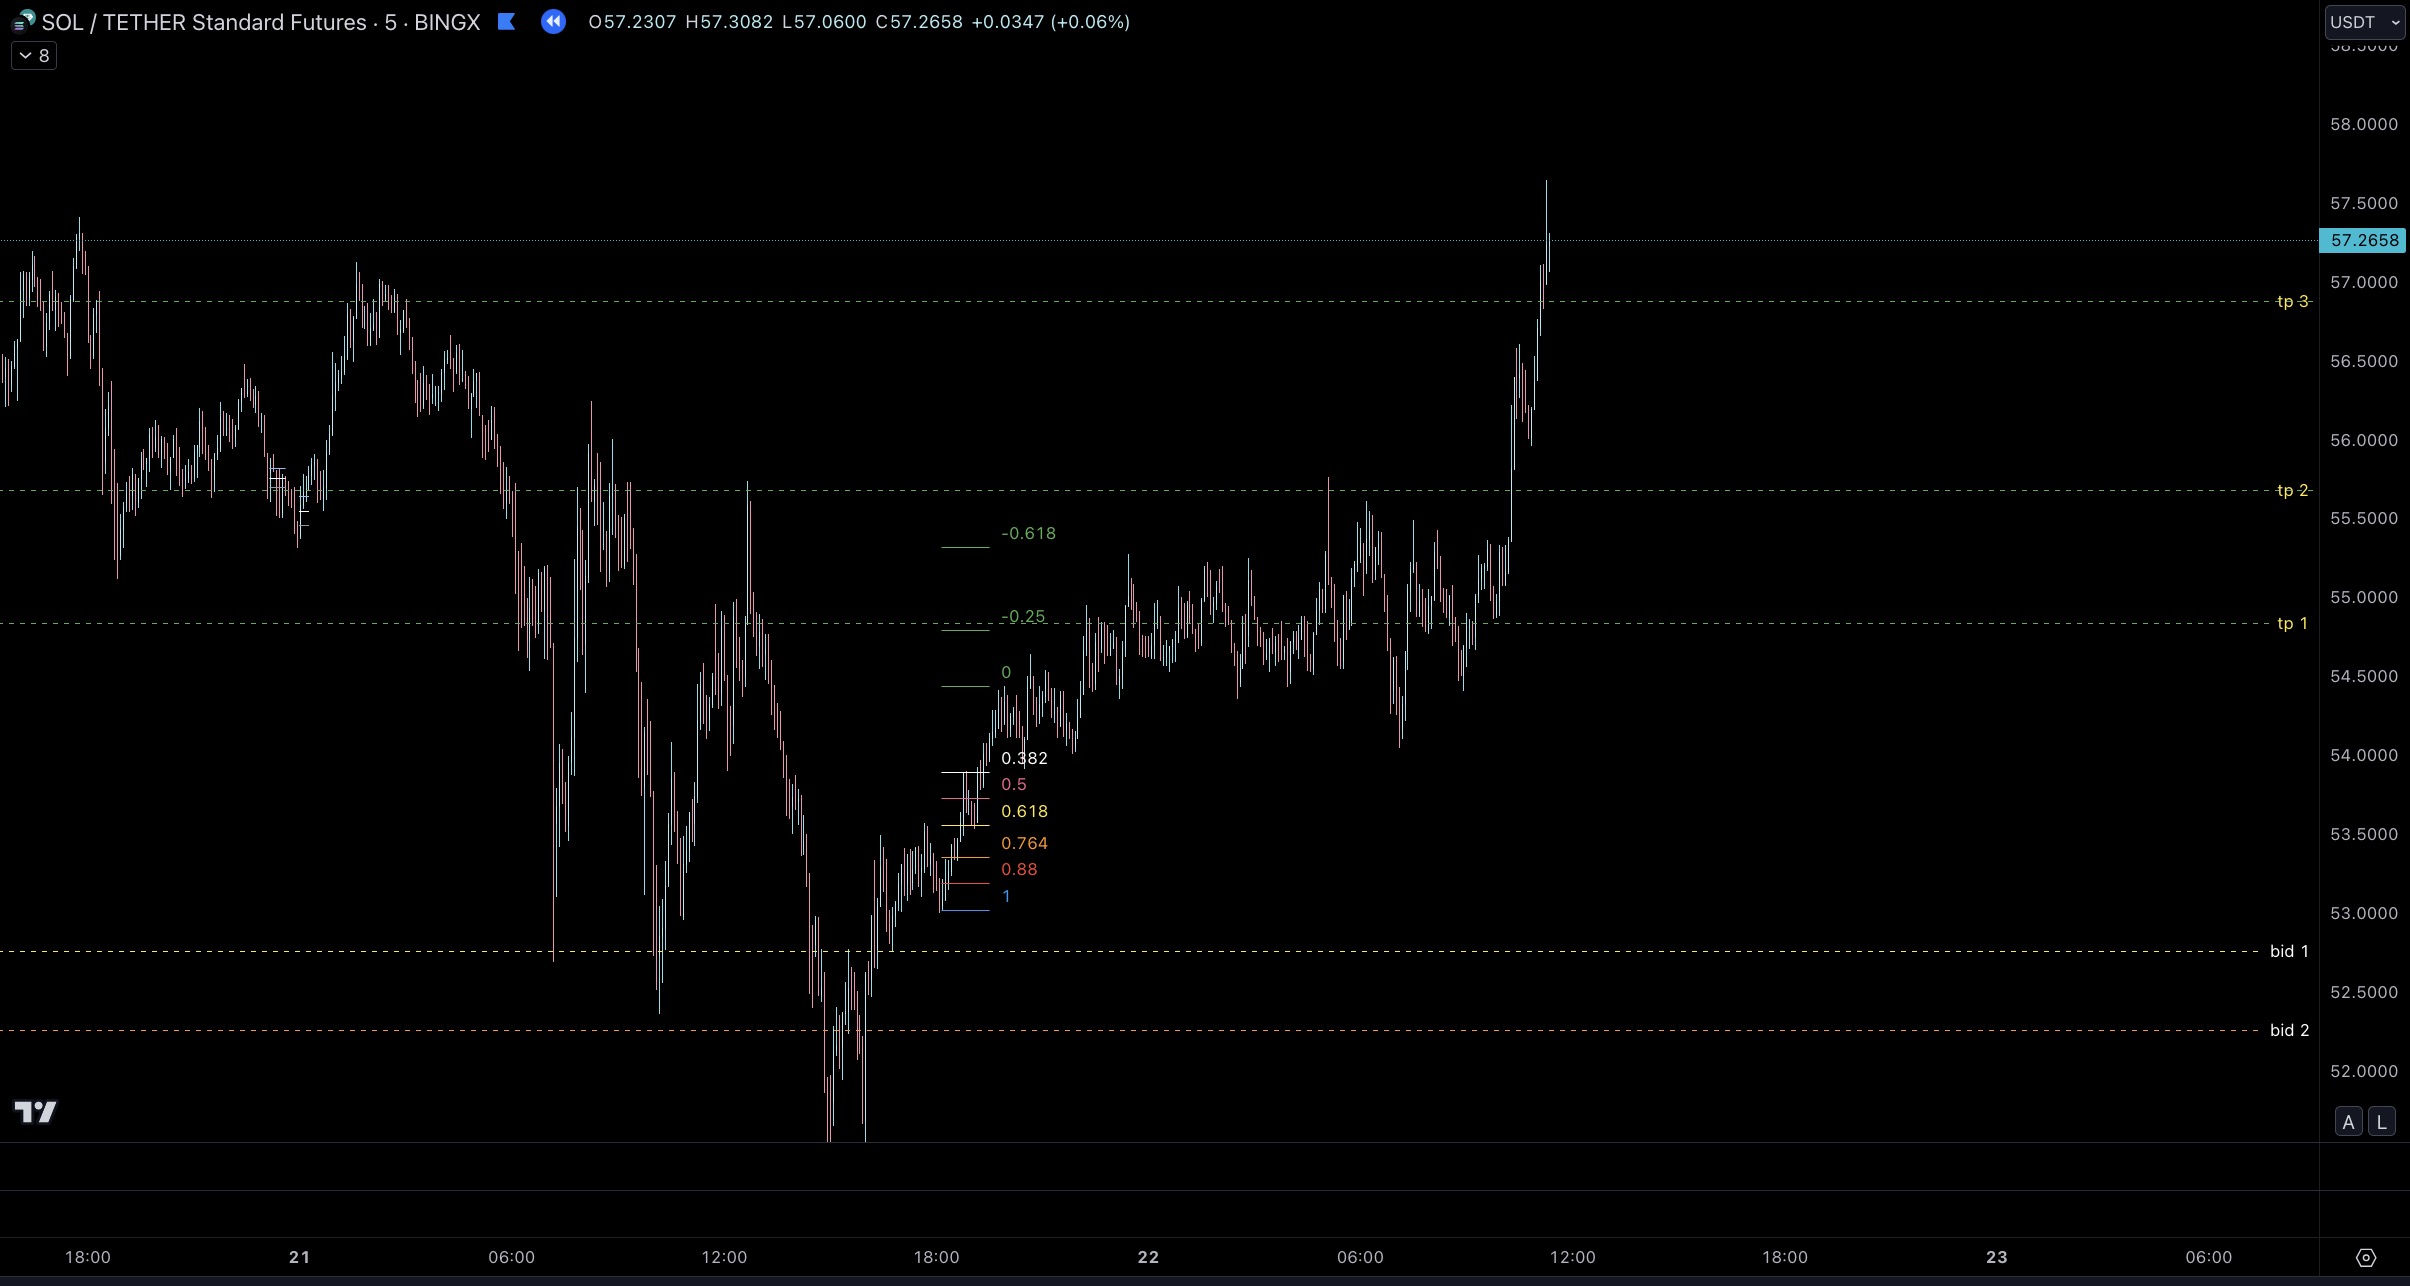
7. Both the 5-minute take profit #3 and the 1-hour take profit #2 are hit in one candle. How nice for me.
8. The 1-hour take profit #3 is hit, but not before some price action that gets awfully close to my stop loss behind the wick at the 0.382 level. SOL has certainly wicked me out before closing above the protected low and continuing upward. But, not this time. At this point, all of my take profits have been hit, and because I'm simply reducing by 50% every time, I still have a small position in play. I move my stop loss up to behind the low of the area between my 1-hour take profits #2 & #3. This way if price continues to rip, I'm along for the ride. If it retraces and takes me out, I'm still well in profit.
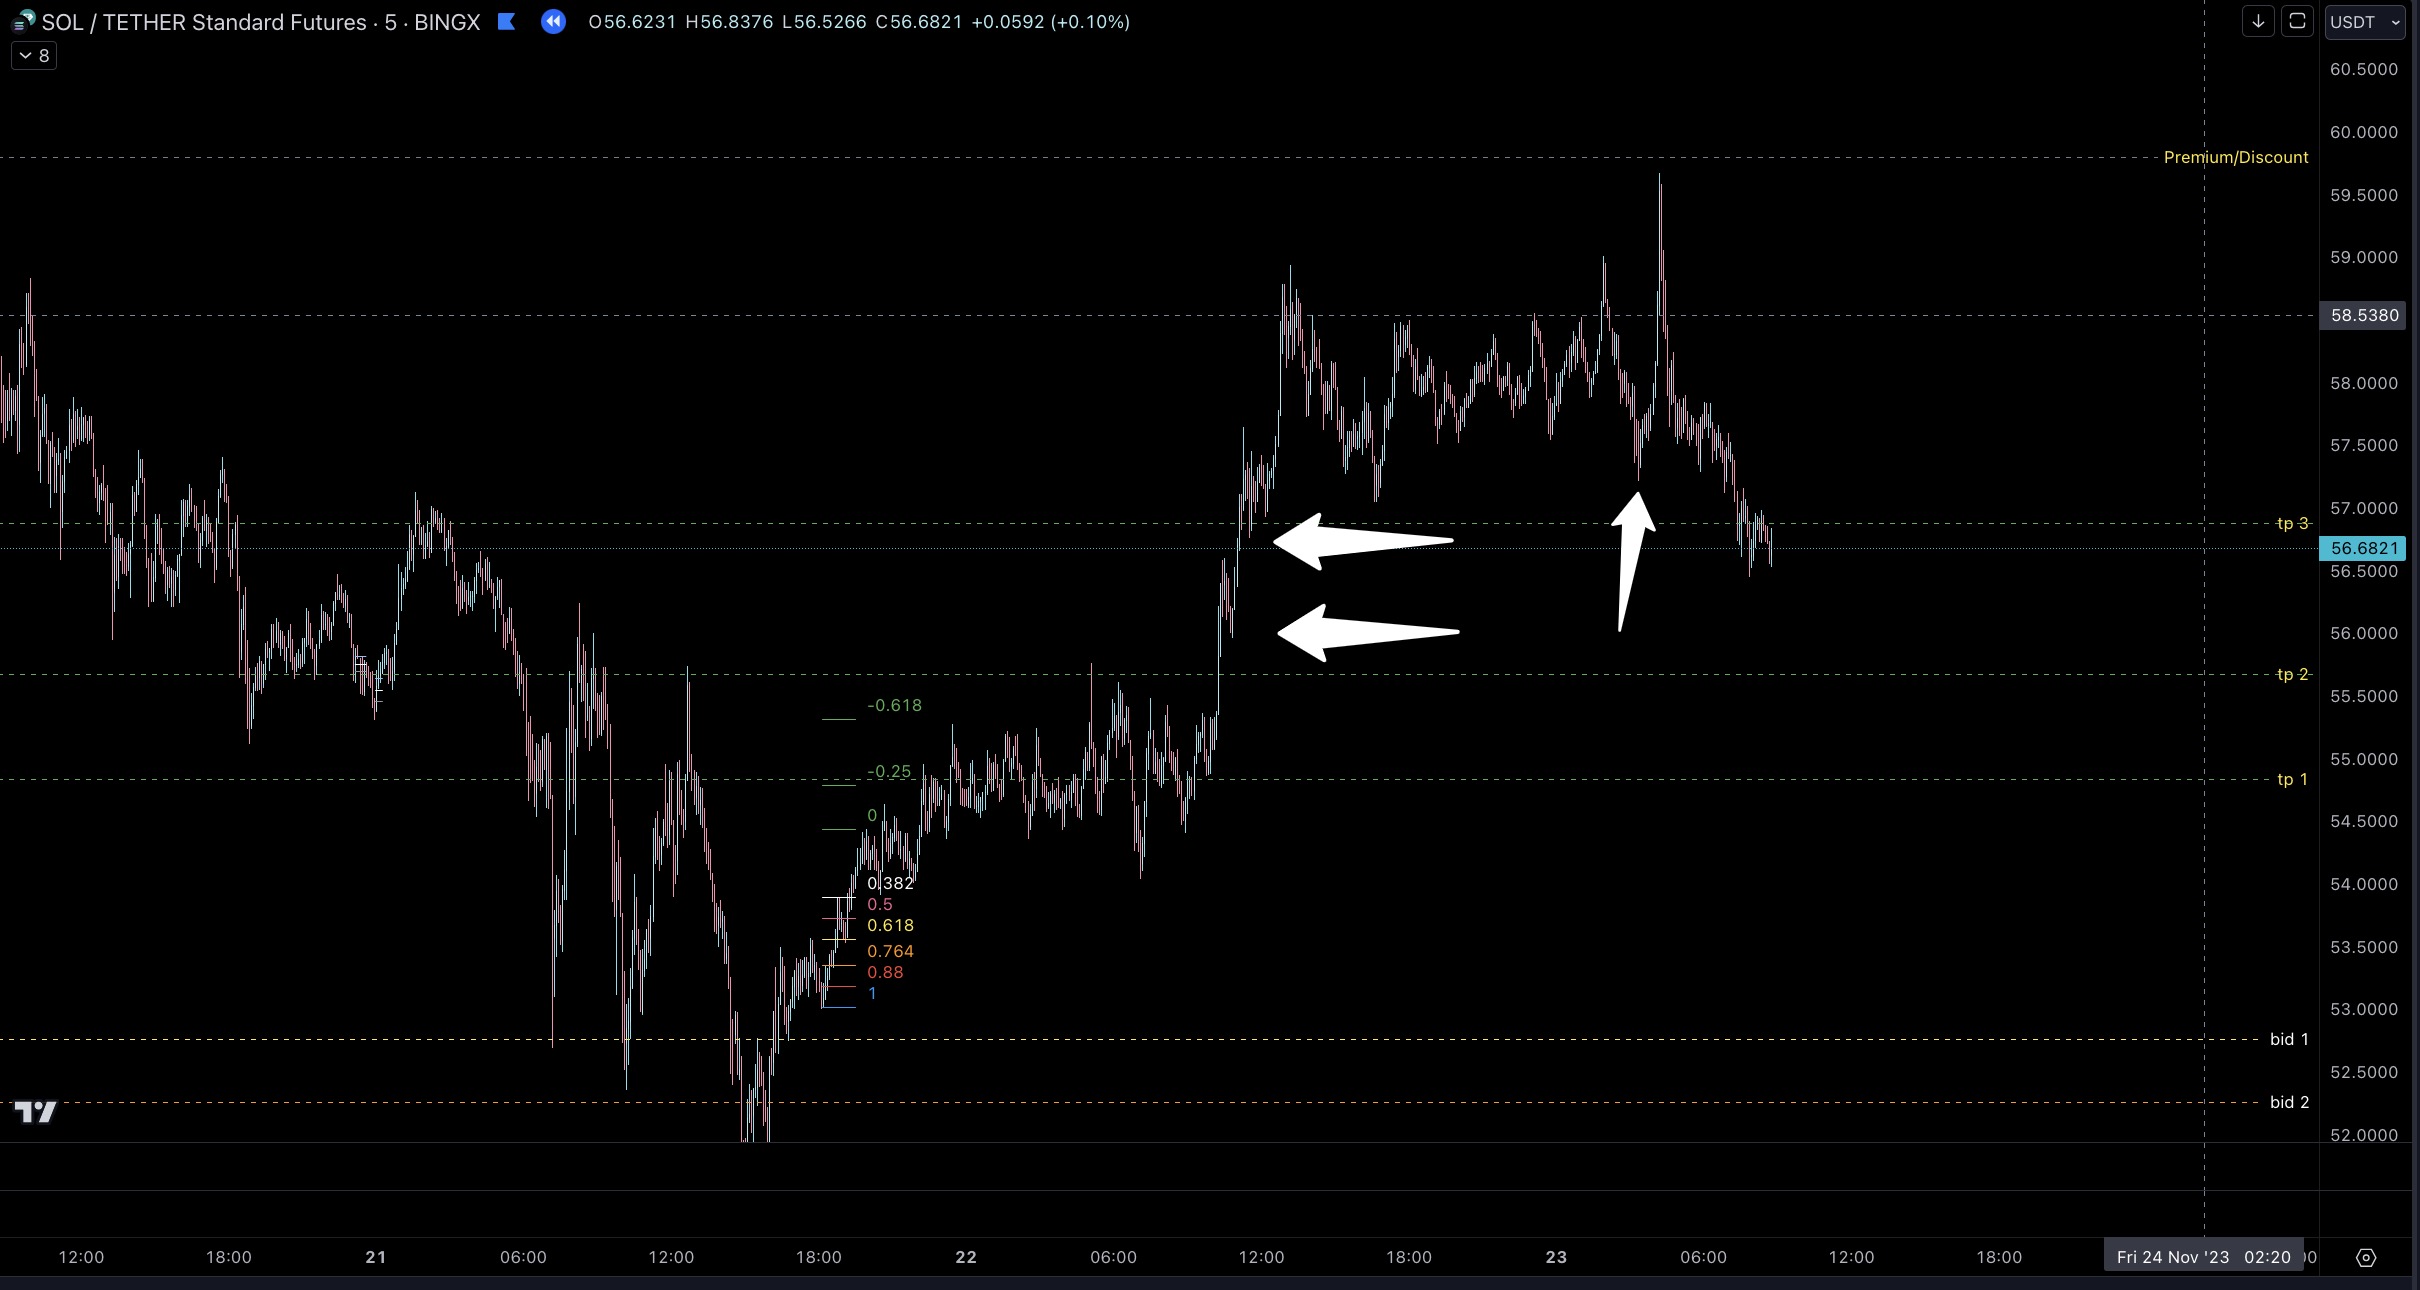
9. As price moves up, I move my stop loss behind areas where new highs were put in afterwards, which are highlighted in the example above by the white arrows. If I'm in front of the chart, I may shave off more on a big pump, like the candle above that gets close to our Premium/Discount line, but price eventually runs through my last stop loss taking me out of the trade well in profit. I leave my 1-hour bids in place and will reassess them if and when price returns to them. Even in a new bearish trend, I would expect to see some reactions off of them for smaller scalps in the worst case scenario.
I like this leaving-a-bit-on-the-table-and-moving-stops-behind-new-lows approach after my fib levels are taken, as it keeps me in larger moves. I never catch 100% of the top, but I'm pulling money out of the market and get to come along for the ride even if the last portion is a small fraction of my original position. Importantly, it aligns well with my psychology, as I'm always much more annoyed when I'm right but missed most of the move than when I'm wrong and had my stops hit. Personal factors may also come into play, e.g., do I have time to babysit this trade all day?, but this is generally how I set up my trades with these indicators.
I sometimes use the RSI formula as my take-profit #3, but I like taking profits on the way up. I've also experimented with the Stocashi/Caffeine Crush, and I sometimes use it to help determine if a move is over.
FINAL THOUGHTS / PROBLEMS
Through the last few months of using this strategy, I've found some instruments are best if you don't use the wicks when measuring (ETH), while other more volatile instruments (SOL, PEPE) benefit from using the wicks. In both cases, an occasional bad entry or missed trade happens, and I'm still studying what has the most accuracy the majority of the time for each instrument.
One issue I've come across is I don't believe there's a way for me to set an alert in TradingView when two successive green or red candles with strength occur on the 1-hour on the Heiken Ashi Algo, so I have to monitor more or less hourly throughout the day. If there was a way to get an alert for this, it would pair really well with the alert I can set when candles cross the +10/-10 HAA threshold on the 5-minute, and I'd be able to get involved in more successful trades. While an alert set up in this way would trigger often, I'd be fine with it. If there was a way to trigger the alert so that it only happens after these two candles with strength occur after a candle of the opposite color (e.g., two green candles with strength occur after a red candle or vice versa) or if the candles were in a overbought or oversold zone, the alert would be even more discriminating and thus more useful.
This ended up being a lot longer and reveals more about the discretionary method of my trading than I planned, but this combination has helped me be patient and select high probability trades. When I initially used the Heiken Ashi Algo, I would rush into a long or short any time the +10/-10 threshold was breached by over 50% of the candle, as outlined in one of CSC's videos. While I had some nice wins, I had some big losers, too. My current strategy is more refined and allows me to be more discriminating, while also giving me a much better risk/reward.
This strategy has existed only in my notes and in my mind, so it feels good to write it all out and subject it to scrutiny. Like everyone else, I'm here to learn, so feel free to pick it apart, trash it, add suggestions, ask questions, etc. I know I will benefit if even one person takes the time to share their thoughts. While I started my trading journey to make "easy" money (LOL), I'm finding that while the money is helpful and validates the time I've spent on this, finding myself on the right side of the market and having a steadily-improving win rate is providing me with the most satisfaction. Cheers,
NT
Replies


nighttalker
Happy to contribute, CSC. I find it easier to grok concepts when they’re fleshed out with examples, so I went that route. Pleased you dug it enough...
Show more
2 years ago
CoffeeShopCrypto
Honestly its a VERY detailed setup. Id like to see you place more of these on the site in the coming weeks. Feel free to keep content like this...
Show more
2 years ago
nighttalker
you got it, E. it’s the least I can do with the amount of free education you’ve gifted. I’m a better trader as a result of your indicators and...
Show more
2 years ago